Manufacturing Data Analytics: From Dashboards to Decision Intelligence


27 August, 2026

Manufacturers collect massive data volumes, yet most are stuck at descriptive analytics: dashboards showing what happened. They invested in BI platforms, built the dashboards, and declared victory. But dashboards rarely change operational behavior, because they show what happened after the fact. Moving to "why did it happen" requires connecting data across systems that were never designed to talk. Moving to "what will happen next" requires models. Moving to "what should we do" requires governance. This guide defines the four tiers, shows where most manufacturers sit, and explains what it takes to move up.
The plateau problem
Per Manufacturing Leadership Council data from 2026, 72 percent of manufacturers rate themselves at mid-level smart-factory maturity, which corresponds to descriptive analytics at best (MLC, 2026). Most built dashboards and stopped. After three to six months, dashboards either sit unused because the insights do not drive decisions, or they get automated into alerts and people stop looking. The real constraint is not technology. The blockers are organizational: data integration fragmented across systems with different definitions, inconsistent data quality, rare and expensive analytical talent, and unclear governance about who owns decisions. Meanwhile 83.1 percent of manufacturers cite raw-material costs as their top challenge this quarter (NAM, Q2 2026), exactly the kind of pressure analytics should help answer in real time, if the foundation were built.
The four analytics tiers
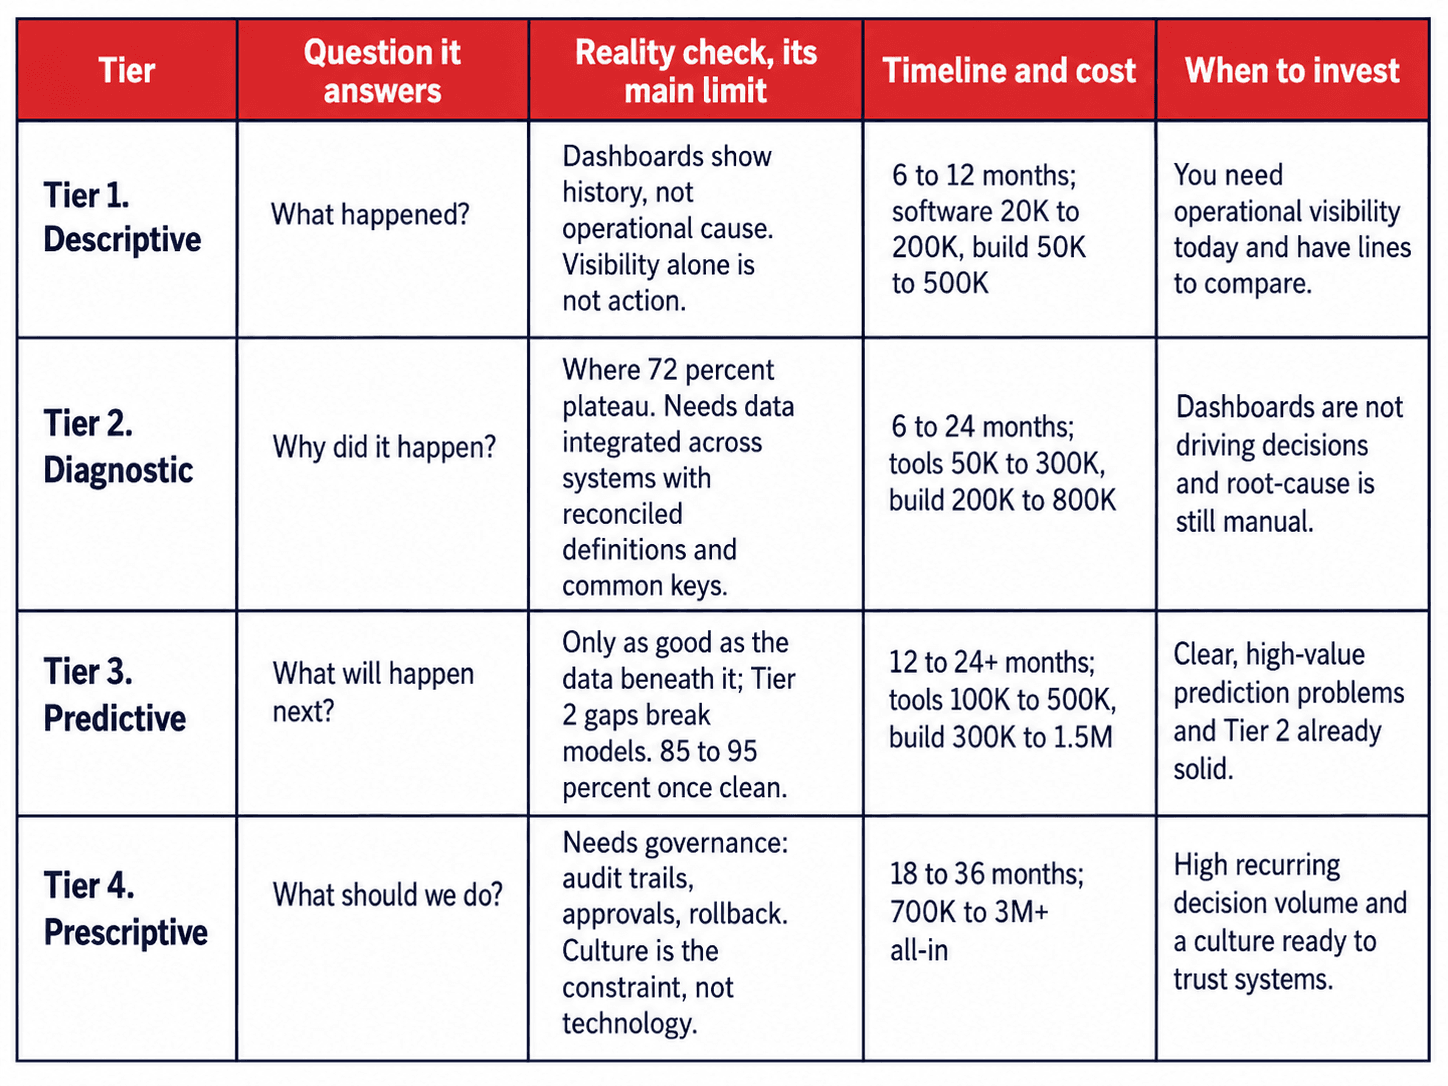
Analytics maturity progresses through four tiers. Each answers a different question and demands different foundational work.
Tier 1. Descriptive
Question it answers: What happened?
Reality check, its main limit: Dashboards show history, not operational cause. Visibility alone is not action.
Timeline and cost: 6 to 12 months; software 20K to 200K, build 50K to 500K
When to invest: You need operational visibility today and have lines to compare.
Tier 2. Diagnostic
Question it answers: Why did it happen?
Reality check, its main limit: Where 72 percent plateau. Needs data integrated across systems with reconciled definitions and common keys.
Timeline and cost: 6 to 24 months; tools 50K to 300K, build 200K to 800K
When to invest: Dashboards are not driving decisions and root-cause is still manual.
Tier 3. Predictive
Question it answers: What will happen next?
Reality check, its main limit: Only as good as the data beneath it; Tier 2 gaps break models. 85 to 95 percent once clean.
Timeline and cost: 12 to 24+ months; tools 100K to 500K, build 300K to 1.5M
When to invest: Clear, high-value prediction problems and Tier 2 already solid.
Tier 4. Prescriptive
Question it answers: What should we do?
Reality check, its main limit: Needs governance: audit trails, approvals, rollback. Culture is the constraint, not technology.
Timeline and cost: 18 to 36 months; 700K to 3M+ all-in
When to invest: High recurring decision volume and a culture ready to trust systems.
Where manufacturers sit, and why progress stalls
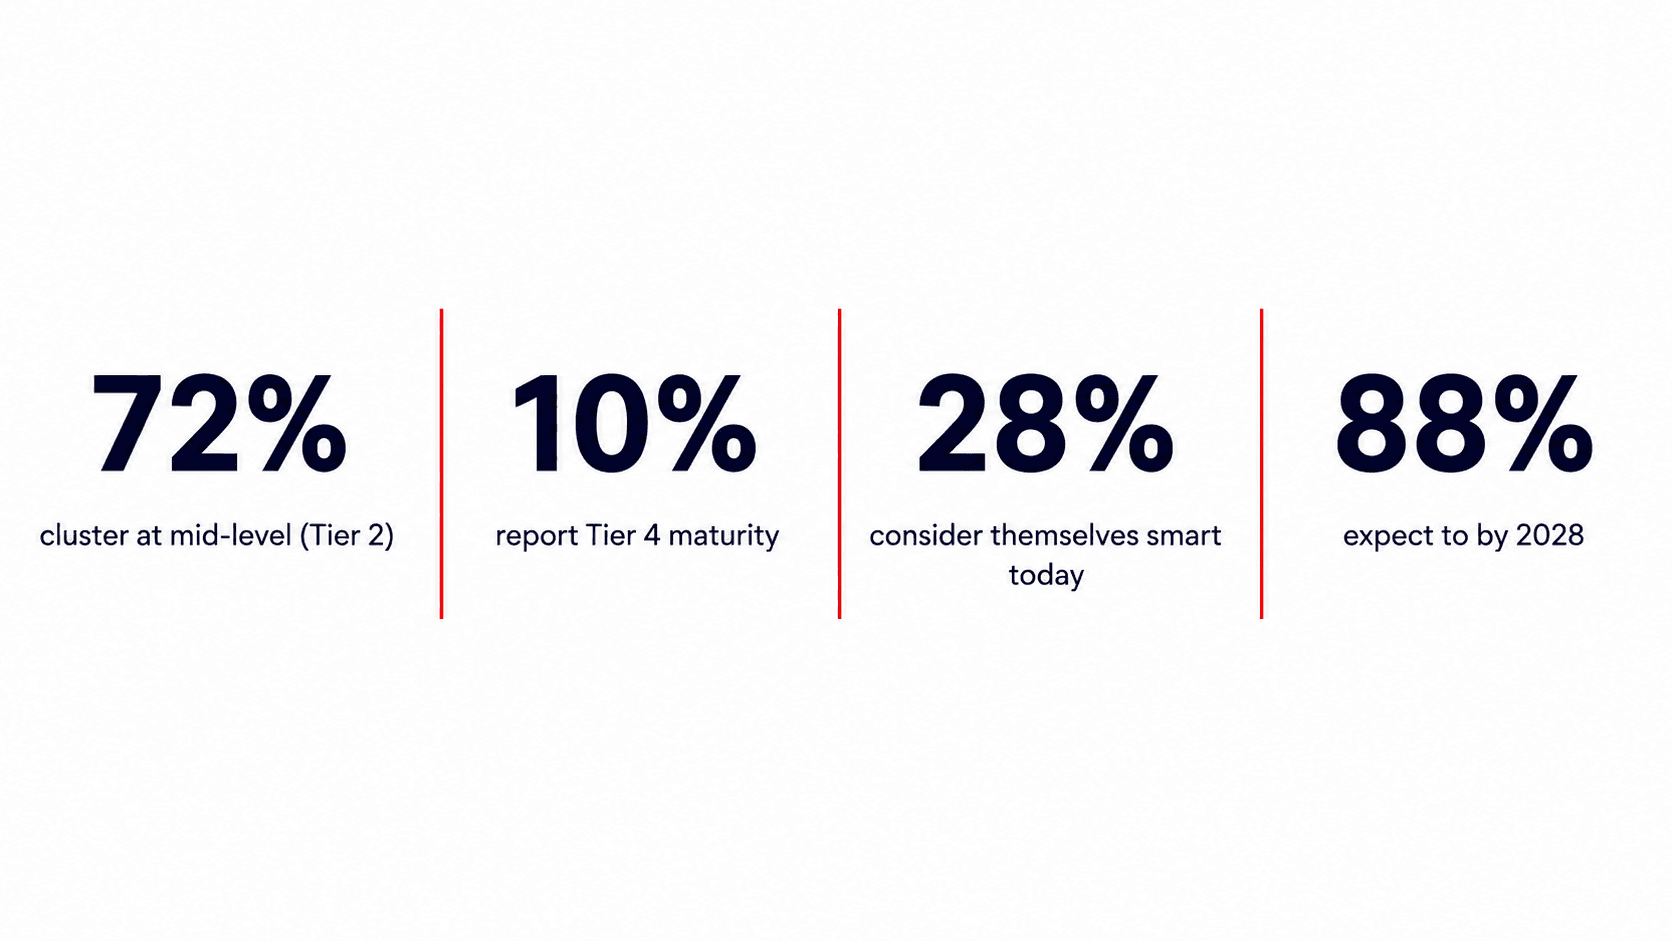
The distribution is consistent: 72 percent cluster at Tier 2, only 10 percent report Tier 4, and the rest spread across Tier 1 and Tier 3. The plateau has four causes. Tiers 1 and 2 show immediate results, while Tiers 3 and 4 carry an eighteen to thirty-six month ROI. The Tier 2 to 3 jump needs data science expertise most plants do not have. A data readiness gap emerges, because models need cleaner, more integrated data than dashboards do. And Tiers 3 and 4 require governance and change management that leaders underestimate. The expectation gap says it all: only 28 percent consider themselves smart today, but 88 percent expect to by 2028.
Which tier are you at?
Maturity is measured by what you can do in operations, not by what you deployed. Beautiful unused dashboards do not count.
.png&w=1920&q=75)
What it takes to move up one tier
.png&w=1920&q=75)
Common questions
Why are we stuck at Tier 2 dashboards?
Because moving to Tier 3 needs data science expertise, clean data, and change-management capacity most companies have not invested in. Data quality issues invisible in dashboards destroy model accuracy. Plan three to six months of data fixing before Tier 3. Many apparent technology failures are foundation failures.
Isn't Tier 4 just science fiction?
Rare in production, not fiction. Most credible Tier 4 systems use supervised autonomy, recommend then approve, not full automation. Governance is the constraint. If the culture is not ready to trust systems, Tier 4 is not ready.
Can we skip Tier 2 and go straight to predictive?
No. Models trained on unintegrated, low-quality data perform poorly. Every successful Tier 3 implementation was built on solid Tier 2 infrastructure.
What is the ROI for each transition?
Tier 1 to 2 is fast and clear. Tier 2 to 3 is longer and depends on problem specificity. Tier 3 to 4 is highest but demands the strongest governance. If the ROI does not justify the transition, stay where you are. Not every manufacturer needs every tier.
Do we need a data scientist on staff?
Not always at first; consultants can build Tier 3 systems. But building internal capability over eighteen to twenty-four months is what makes it sustainable.
For a deeper look at how those capabilities translate into practical AI initiatives across manufacturing operations, explore CodeNinja’s AI solutions for manufacturing.